Why your best selling items still leave you with dead stock is all in the size curve
It’s one of the most confusing paradoxes in fashion retail. You have a best selling product that flew off the shelves, yet at the end of the season, you’re still left with a pile of the exact same item on the clearance rack. Customers loved it, but your final profit margin tells a different story. How can a “winner” also be a loser? The answer often lies in a hidden, yet powerful, operational detail, the size curve.
Getting your size distribution right isn’t just about avoiding markdowns. It’s about maximizing the potential of every single product you buy. A poorly planned size curve creates two problems at once. It leads to “hidden stockouts” on your most popular sizes, leaving potential sales on the table, while simultaneously creating a mountain of dead stock in sizes that were never going to sell in that location. This is the silent profit killer that can undermine even the best merchandising strategies.
What exactly is a size curve?
A size curve, sometimes called a size run or size break, is the map that dictates how many units of each size you should buy for a particular product. In a perfect world, this would look like a neat bell curve, with the most units ordered in medium sizes and fewer at the extremes like XS and XXL. However, fashion retail is rarely that simple.
The reality is that every product, every store, and every customer demographic has its own unique size demand. A fitted dress will have a different size curve than a loose, oversized sweater. A store in a college town will have a vastly different size profile than one in a retirement community. Relying on a generic, company-wide size curve is like using a map of New York to navigate London, you might be in the right general area, but you’re going to get lost quickly.
The consequence of a misaligned size curve is a painful inventory imbalance. You sell out of mediums and larges in the first two weeks of the season, frustrating customers and losing out on full price sales. Meanwhile, the XS and XXL sizes sit on the shelf until they are eventually marked down by 50% or more, erasing the profit you made on the sizes that did sell.
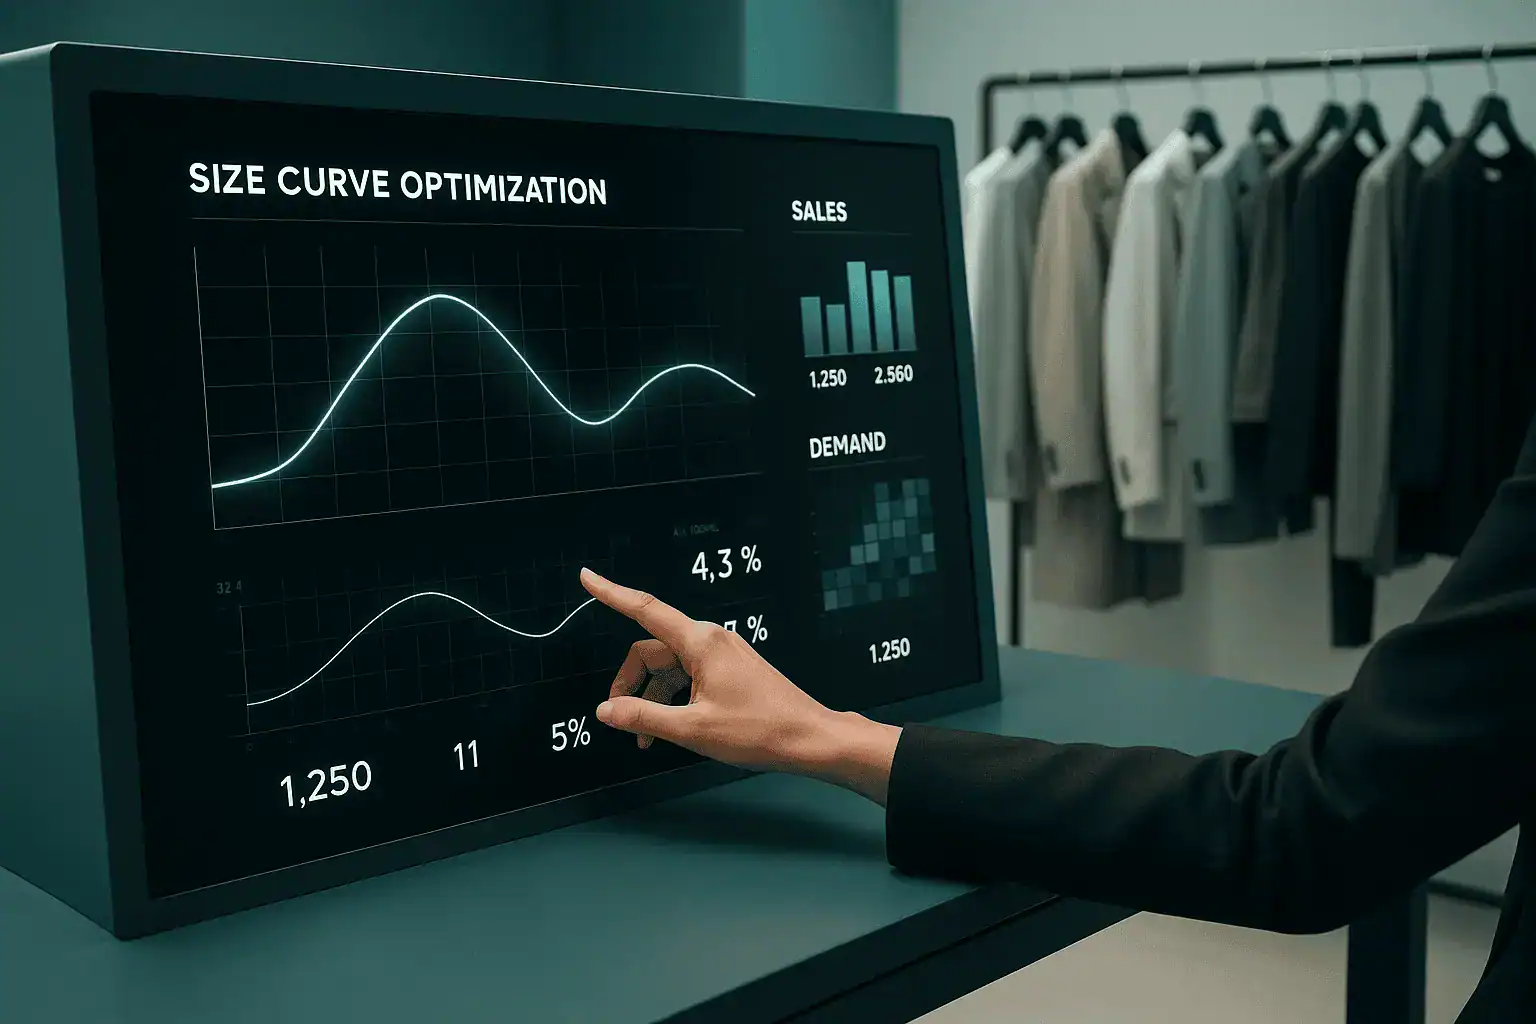
As the visual above illustrates, the same buy can create scarcity and excess at the same time. This isn’t a merchandising failure, it’s a planning failure. It’s the direct result of not aligning your inventory investment with true customer demand at the most granular level. This imbalance directly harms your ability to achieve a healthy sell through rate, a critical measure of how much of your inventory is sold at full price.
The common mistakes that break your size curve
Achieving the right size balance is challenging, and many retailers fall into common traps that lead to the problems of overstock and stockouts. Understanding these pitfalls is the first step toward correcting them and improving your inventory health.
A few of the most frequent mistakes in size curve planning are as follows.
- Applying a single curve to everything:
This is the most common error. A retailer might use one standard size curve for all dresses, regardless of fit, fabric, or target customer, which ignores the nuance of individual product demand.
- Ignoring regional and demographic signals:
A store located near a university will likely need more smaller sizes, while a store in a suburban area with an older demographic may require a different size distribution. Failing to adjust for this variance guarantees inventory imbalances.
- Mismanaging pre packs:
Suppliers often sell products in pre determined size assortments, or pre packs. While convenient, these packs rarely match the specific demand of an individual store, forcing retailers to either accept the imbalance or order in more expensive loose packs.
- Relying on gut feel instead of data:
Historical sales data, when analyzed correctly, tells the true story of size demand. Many businesses still rely on instinct, which can’t compete with the precision of data driven AI inventory management.
How to build a smarter size curve
Moving from guessing to a data driven strategy doesn’t have to be complicated. The goal is to create tighter size curves that more accurately reflect what your customers are actually buying. This involves looking at your own history and understanding the external factors that influence demand.
A smarter approach starts with a deep dive into your historical sales data. Instead of just looking at total units sold, you need to analyze sales by size, by product, and by location. This historical view is the foundation of any accurate AI demand forecasting for inventory planning. Ask questions like, “For this specific style of jean, what was the size breakdown of sales at our downtown store versus our suburban mall store?”
The insights from this analysis help you build a unique size profile for each item and location. This allows you to allocate inventory with much greater precision, ensuring that the right sizes are in the right place at the right time. The result is a positive feedback loop, better allocation leads to fewer stockouts, which increases full price sales. This boosts your sell through rate, increases profit margins, and reduces the need for costly end of season markdowns.
The future of size planning is agentic AI
Manually analyzing sales data for every product in every store is a monumental task prone to human error. This is where modern technology provides a significant competitive advantage. As an agentic AI company, WAIR.ai develops systems that go beyond simple analysis. Our AI agents can analyze millions of data points, including historical sales, demographics, weather patterns, and local events, to create hyper accurate size curves automatically.
This is a fundamental shift from traditional AI, which might only provide dashboards and insights. Agentic AI vs traditional AI in retail is about turning those insights directly into action. For example, an agent can not only predict the ideal size curve for a new line of coats in your Boston store but also autonomously execute the allocation and replenishment orders to match that prediction. This level of automation prevents the accumulation of dead stock and ensures you can capitalize on every sales opportunity.
By leveraging sophisticated technology, you can move beyond reactive decision making and build a proactive inventory strategy that maximizes profitability and minimizes waste.
Turn sizing from a guess into a growth engine
Poor size curve planning is more than just an inventory headache, it’s a direct drain on your profits and a barrier to growth. By leaving sales on the table with stockouts and eroding margins with markdowns, it undermines your success from the inside out.
The shift toward a data driven approach, powered by intelligent automation, transforms sizing from a source of risk into a strategic advantage. When you consistently have the right sizes in the right stores, you sell more at full price, build stronger customer loyalty, and create a more sustainable and profitable business. It’s time to stop letting the wrong sizes dictate your bottom line and start using precise, intelligent planning to fuel your growth.
Explore how AI inventory management software can help you build the perfect size curve for every product, every time.
Frequently asked questions
Q: What is a size run in retail?
A: A size run refers to the complete range of sizes a specific product is offered in, for example, from XS to XL or from size 2 to size 14. A retailer’s purchase order will specify how many units of each size in the run they are buying.
Q: How is the sell through rate calculated?
A: Sell through rate is calculated by dividing the number of units sold by the number of units received from the supplier, then multiplying by 100 to get a percentage. For example, if you received 100 shirts and sold 70 in a month, your sell through rate would be 70%.
Q: What is the difference between a pre pack and a loose pack?
A: A pre pack is a pre-assorted box of goods from a supplier with a fixed ratio of sizes (e.g., one small, two mediums, two larges, one X large). A loose pack allows a retailer to order specific quantities of individual sizes, offering more flexibility but sometimes at a higher cost per unit.
Q: How can I create a size curve for a new product with no sales history?
A: For new products, you can use data from a “like for like” or comparable product. Analyze the historical size selling data of a similar item from a previous season to create a baseline size curve for the new product. Advanced AI forecasting tools can automate this process by identifying similar attribute products to generate a highly accurate forecast.
Q: Why is it bad to use revenue to calculate a size curve?
A: Using revenue can distort your size curve because it can be influenced by promotions and markdowns. A size that sold heavily on clearance would appear more important from a revenue perspective than it actually was at full price. Calculating your curve based on full price units sold provides a much more accurate picture of true customer demand.