Leveraging Returns Data: The Untapped Goldmine for Proactive Margin Improvement in Fashion Retail
In the competitive world of fashion and lifestyle retail, product returns are often viewed as an unavoidable cost center, a drain on profitability that simply needs to be managed. This perspective, however, overlooks a crucial truth: every return is a rich vein of data, an invaluable resource that, when mined effectively, can proactively improve your forward margins and fundamentally reshape your business strategy. For decision-makers evaluating solutions, understanding how to transform this operational challenge into a strategic asset is key to sustainable growth.
Understanding the True Cost of Returns
The financial impact of product returns extends far beyond the initial refund. While direct costs like shipping, restocking, and inspection are clear, a significant portion of the expense hides in indirect and often overlooked areas. Did you know returns can cost eCommerce businesses an astonishing 66% of an item’s original price? This figure highlights the urgency of addressing returns not just reactively, but strategically.
Consider the full spectrum of costs:
- Direct Costs:
- Shipping and logistics:
Expenses for inbound return shipping and potentially outbound for exchanges.
- Processing and inspection:
Labor costs for handling, verifying, and assessing returned items.
- Restocking and repackaging:
Preparing items for resale, often involving new packaging.
- Disposal or liquidation:
Costs associated with unsaleable items, which can be significant.
- Indirect and Hidden Costs:
- Inventory depreciation:
Items held in transit or processing lose value, especially in fast-moving fashion.
- Customer service:
Labor and resources dedicated to managing return inquiries.
- Customer churn:
A poor return experience can make acquiring a new customer 6 to 7 times more expensive than retaining an existing one, impacting long-term revenue.
- Fraud:
Approximately 8.5% of returns are fraudulent, adding another layer of loss.
- Environmental impact:
The carbon footprint of reverse logistics and waste.
The average online shopper returns items 20 to 30% of the time, with apparel alone seeing an average return rate of 22% for online purchases. These statistics underscore the enormous potential for margin recovery and improvement when returns data is leveraged effectively.
Returns Data: What to Collect and Why it Matters
To transform returns into a strategic asset, you must first systematically collect and analyze the right data. This means going beyond basic return counts to capture granular details that reveal underlying patterns and root causes. Establishing a robust retail AI data foundation is the first critical step.
Here are key data points and why they are essential:
- Product-level data:
- Return reason codes:
Detailed and standardized reasons (e.g., “too small,” “color inaccurate,” “damaged,” “not as described”) are crucial for identifying specific product flaws or content inaccuracies.
- Product category and SKU:
Pinpointing which types of products or individual items have higher return rates.
- Description accuracy scores:
Internal assessments or customer feedback on how well the product description matched the actual item.
- Defect rates:
Identifying manufacturing or quality control issues.
- Customer-level data:
- Purchase history:
Understanding if certain customers are frequent returners.
- Return history:
Tracking individual customer return patterns and values.
- Feedback:
Leveraging surveys, reviews, and direct customer service interactions for qualitative insights.
- Operational data:
- Return channel:
Whether the return originated online, in-store, or via a specific courier.
- Processing time:
How long it takes from return initiation to refund or exchange, impacting customer satisfaction and inventory velocity.
- Disposition:
What happens to the item (resell, refurbish, liquidate, dispose), directly affecting recovery value.
- Shipping costs:
Detailed costs per return transaction.
- External factors:
- Seasonality and promotional periods:
Identifying if return rates fluctuate during sales events or specific times of the year.
- Market trends:
Understanding broader shifts in consumer preferences that might influence returns.
Phase 1: Reactive Optimization – Minimizing Current Return Impact
Before you can proactively leverage returns data, optimizing your current retail returns management AI processes is essential. This phase focuses on reducing immediate costs and improving the customer experience during the return journey.
Retailers can achieve significant gains by focusing on several key areas:
- Optimizing return policies:
- Clarity and transparency:
Ensure policies are easy to understand and readily accessible, setting clear expectations.
- Fraud resistance:
Implement measures to identify and deter fraudulent returns, which account for roughly 8.5% of all returns.
- Streamlining return processes:
- Automation:
Use technology to automate return initiation, tracking, and communication, improving efficiency.
- Efficient logistics:
Optimize reverse logistics to reduce transit times and processing delays.
- Rapid refunds and exchanges:
Expedite these processes to enhance customer satisfaction and encourage exchanges over refunds.
- Mitigating return fraud:
- Pattern identification:
Leverage data analytics to spot suspicious return behaviors.
- AI driven detection:
Deploy AI to flag high-risk returns for further verification.
- Inventory disposition:
- Smart handling:
Quickly assess returned items for their best disposition—resale, refurbishment, liquidation, or donation—to maximize recovery value and minimize waste.
Phase 2: Proactive Improvement – Shaping Future Margins with Data
This is where returns data truly transforms from a cost center into a strategic differentiator. By analyzing return patterns and reasons, you gain insights to make upstream decisions that prevent future returns and significantly boost your forward margins.
Informing Product Development
Returns data provides invaluable feedback directly from your customers, highlighting areas for product improvement and innovation.
- Identifying design flaws and quality issues:
- Common return reasons:
“Product damaged,” “poor quality,” or “didn’t meet expectations” can signal fundamental issues in design, manufacturing, or material selection.
- Iterative improvement cycles:
Use this feedback to inform product updates, material choices, and quality control processes for future collections.
- Prioritizing feature enhancements:
- Unmet customer needs:
Return reasons like “not what I expected” or “lacks functionality” can point to features that customers are looking for, guiding new product development.
Refining Marketing and Content
Inaccurate or insufficient product information is a major driver of returns. Leveraging returns data allows you to create more precise content that sets accurate customer expectations.
- Improving product descriptions and images:
- Clarity on fit and material:
If “sizing issues” or “material not as expected” are common, refine descriptions to be more explicit, add detailed size guides, or include more texture-focused imagery.
- Setting accurate expectations:
Use descriptive language and high-quality visuals to ensure customers know exactly what they are purchasing.
- Targeting messaging:
- Reducing “buyer’s remorse”:
Tailor messaging to address common concerns that lead to returns, such as detailed care instructions or usage tips.
- Personalized recommendations:
- Past return behavior:
Use customer behavior analytics to inform personalized product recommendations, avoiding items that customers have historically returned.
Optimizing Inventory and Allocation Strategies
AI-driven insights from returns data enable a more precise and profitable approach to inventory management. This directly impacts your bottom line by reducing excess stock and lost sales.
- AI driven return prediction:
- Forecasting return rates:
Utilize advanced AI models to predict return rates at the SKU, size, or category level before items are even sold. This allows you to plan for net sales rather than gross demand.
- Adjusting purchasing and manufacturing:
- Net sales planning:
Factor predicted returns into your buying and production decisions, reducing the risk of overstocking high-return items.
- Identifying high-return risk products:
- Product re evaluation:
Proactively flag products with consistently high return rates for re-evaluation, modification, or potential discontinuation.
- Dynamic inventory allocation:
- Optimized distribution:
Adjust initial inventory allocation and replenishment strategies based on expected return rates across different stores or channels. This ensures the right product is in the right place at the right time, minimizing the impact of returns on overall stock levels.
Implementing a Returns Data Strategy
Implementing a comprehensive returns data strategy requires a blend of technology, process, and cross-functional collaboration. For retailers evaluating a partner, this means looking for solutions that integrate seamlessly and provide actionable intelligence.
- Technology stack:
- Returns Management Systems (RMS):
Essential for automating and streamlining the return process.
- Data Analytics Platforms:
Tools to aggregate, clean, and visualize returns data.
- AI/ML Tools:
Crucial for advanced predictive analytics and identifying complex patterns.
- Data integration:
- Connecting systems: Ensure your POS, CRM, WMS, and e-commerce platforms communicate effectively to provide a holistic view of the customer and product journey.
- Team collaboration:
- Bridging departments:
Marketing, product development, operations, and finance teams must collaborate to share insights and act on returns data.
- Do different departments within your organization have access to and a clear mandate to use returns data? A unified approach ensures consistency and maximizes impact.
- Key metrics (KPIs):
- Tracking performance:
Monitor return rate by product/category, cost per return, exchange rate, and net promoter score (NPS) after a return to gauge the effectiveness of your strategy. Understanding these key inventory performance indicators is vital for measuring success.
The Future: Agentic AI and Hyper-Optimized Returns Management
The evolution of AI is rapidly transforming returns management from a reactive chore into a hyper-optimized, predictive science. What if your systems could autonomously predict return rates, identify high-risk products, and even adjust inventory and content strategies in real-time? This is the promise of agentic AI.
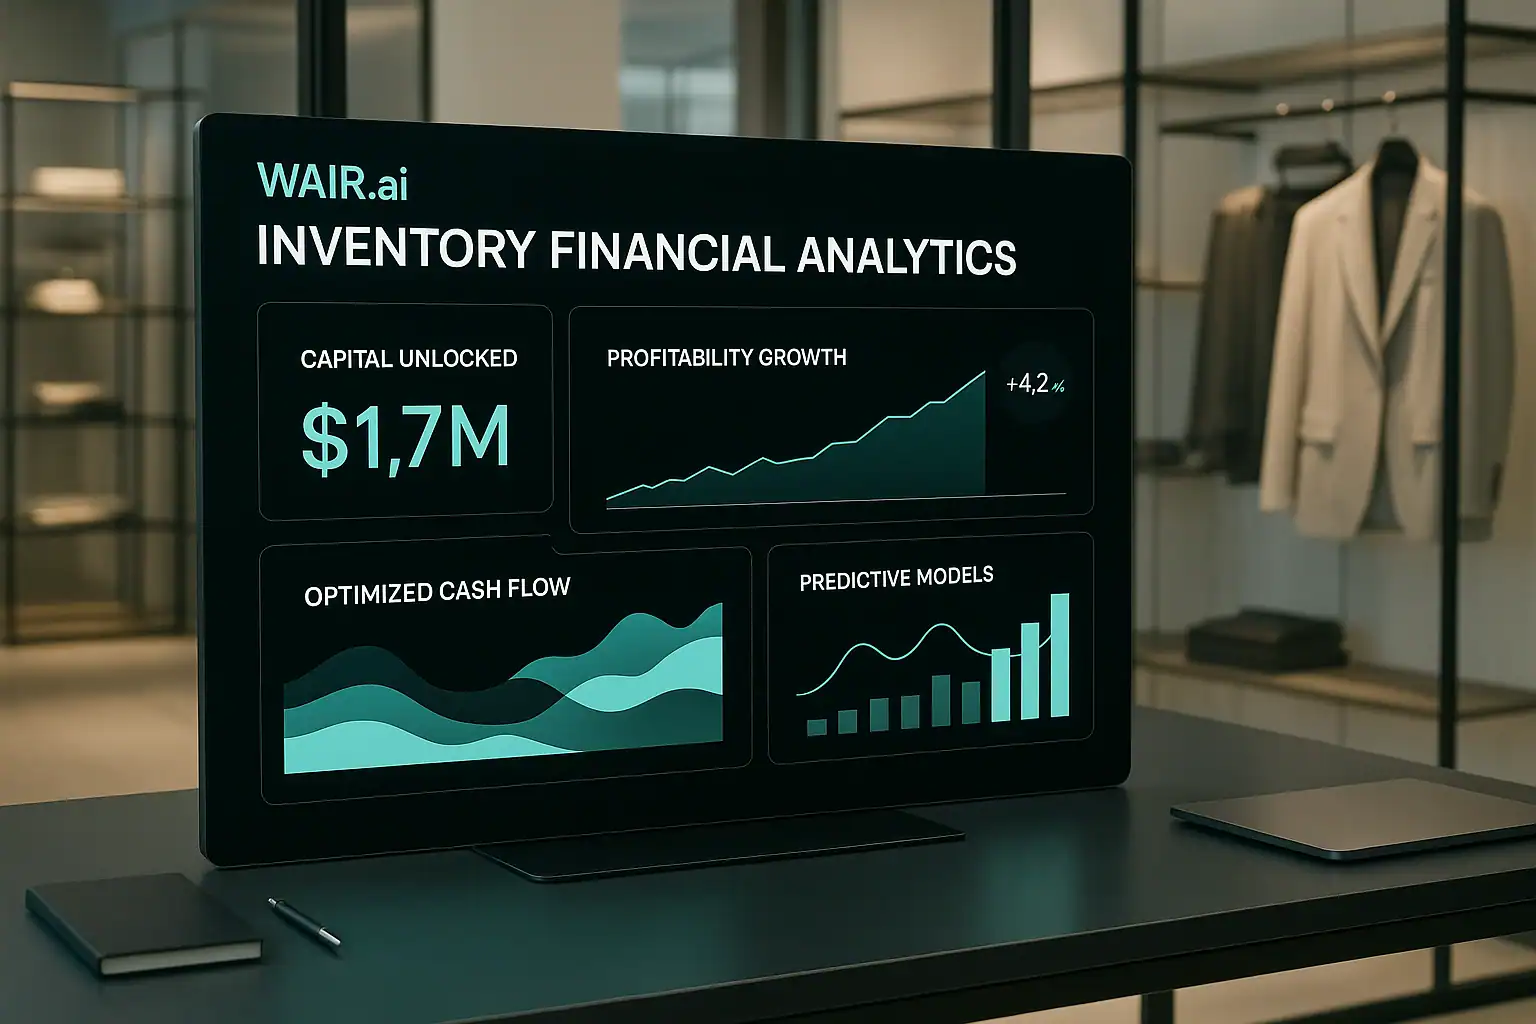
An agentic AI company like WAIR.ai doesn’t just provide data; it offers intelligent agents that can:
- Autonomously balance inventory, pricing, and returns:
These systems analyze vast datasets, simulate scenarios, and make decisions that optimize for multiple, sometimes conflicting, objectives like minimizing returns while maximizing sell-through and margin.
- Predictive return management at the transaction level:
Imagine being able to anticipate the likelihood of a return for each individual transaction based on a multitude of factors, allowing for proactive interventions or adjustments.
- Self-optimizing returns ecosystem:
This vision sees returns processes fully integrated with product development, marketing, and supply chain, where insights automatically trigger adjustments across the entire retail operation, creating a truly sustainable retail strategy.
Driving Future Profitability through Returns Intelligence
The shift from viewing returns as mere costs to embracing them as valuable data is a paradigm shift that separates leading retailers from the rest. By investing in the right strategies and agentic AI solutions, you can proactively influence your future margins, reduce waste, enhance customer satisfaction, and gain a significant competitive edge. The question isn’t whether you can afford to leverage returns data; it’s whether you can afford not to. Start your journey toward higher profitability today by transforming returns into your most powerful strategic asset.
Frequently Asked Questions
Q: How much does poor returns management cost retailers?
A: Poor returns management can be incredibly costly, with the average eCommerce return costing up to 66% of the item’s original price. This includes direct costs like shipping and processing, as well as hidden costs like inventory depreciation, customer service, and the loss of future business due to churn.
Q: What are the most common reasons for product returns in fashion retail?
A: In fashion retail, common return reasons often include “sizing issues,” “item not as described or pictured,” “poor quality,” “changed mind” (buyer’s remorse), and “arrived damaged.” Collecting detailed return reason codes is crucial for identifying patterns and addressing root causes.
Q: How can AI help businesses reduce product return rates and improve margins?
A: AI can help businesses by providing predictive analytics for return rates at a granular level, identifying products with high return risk, and informing strategic adjustments to inventory, product development, and marketing content. This proactive approach minimizes future returns, reduces associated costs, and protects profit margins.